Curve
This component outputs the Y-value from an X-value defined by up to 10 XY-points.
With 2 curve points the behavior is identical to the Reset component in kitControl.
- X axis must be positive: x1 < x2 < x3 ...
- Outputs null if invalid input, XY-parameters or X axis is not positive.
- X input is clamped to smallest and greatest X-value.
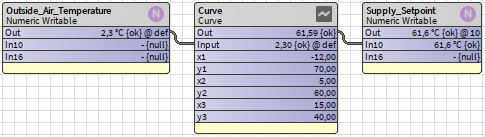
Below is an example with 3 XY-points, used to calculate a supply temperature from outside air temperature.
The curve can be viewed and edited sing CurveViewChartWidget
Property Sheet
| Name | Description |
|---|---|
| Points Count | The number of XY points. (2-10) |
| Out | The calculated Y output value. |
| Input | The input X value. |
| x1 | X-axis value. |
| y1 | Y-axis value. |
| x2 | X-axis value. |
| y2 | Y-axis value. |
| ... |
CurveViewChartWidget
This is a HTML5 widget for the Curve component.
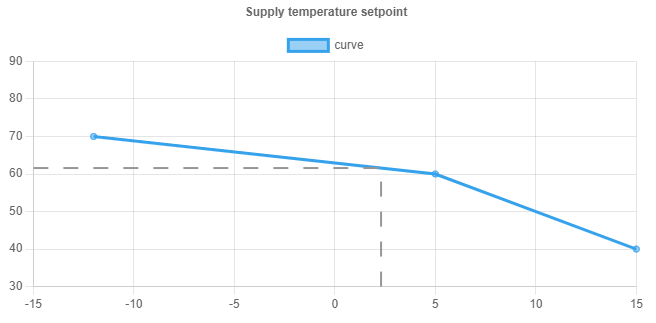
The widget is a line chart which allows an intuitive way to manipulate the curve.
A dashed line indicates the current calculated output.
- Under the Ux folder in jmLogicKit drag and drop the CurveViewChartWidget into a PX graphic.
- In Properties, change ord to location of Curve component.
The curve points can be dragged up and down on the widget, and the Y-values are updated accordingly.
The widget can be made read-only by setting the Editable property to false.
Note: Web server (Services/WebService) must be enabled in station in order to use this widget.
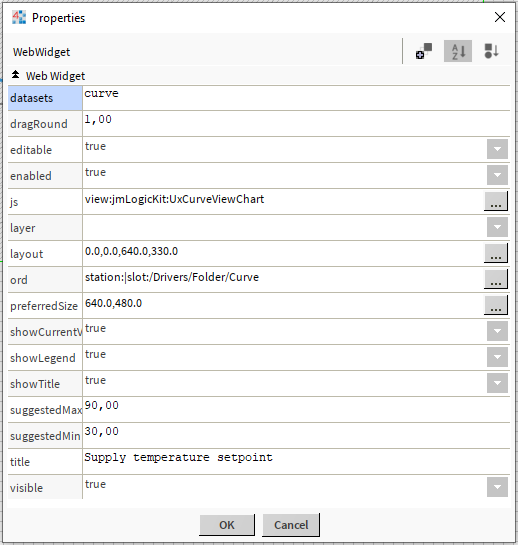
Properties
| Name | Description |
|---|---|
| datasets | Name of the line chart. |
| dragRound | ? |
| editable | Toggle whether widget is read-only. |
| enabled | If disabled widget doesn't update. |
| js | Don't touch |
| layer | Px Layer |
| layout | X / Y / Width / Height |
| ord | Points to Curve component |
| preferredSize | ? |
| showCurrentValue | Toggles dashed line |
| showLegend | Toggle the "datasets" text |
| showTitle | Toggles the title text |
| suggestedMax | Maximum Y-value for chart |
| suggestedMin | Minimum Y-value for chart |
| title | Title text |
| visible | Toggle visibility |